3 Ways to Add a Target Line to an Excel Pivot Chart
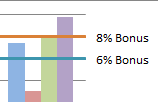
Add a Target Line to an Excel Pivot Chart
Many Excel users use Pivot Tables and they find it very easy to create a Pivot...
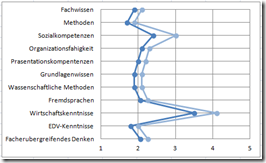
Company and Industry P/E (Price to Earnings) Line Chart – 2 Ways
Here is a fun and easy Dynamic Excel Chart that you can use in your Excel Dashboard Template.
This Excel Chart has many financial research,...
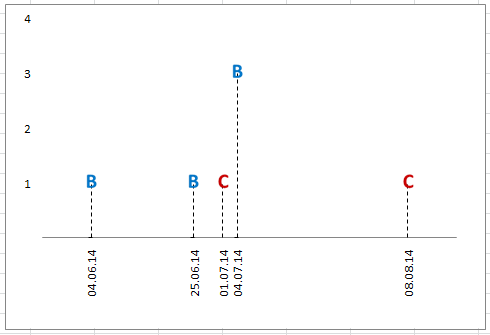
Excel Line Charts Using a Date Axis
Not sure if you knew this or not, but Excel is amazing!
The makers of Microsoft Excel even went so far as to make sure...
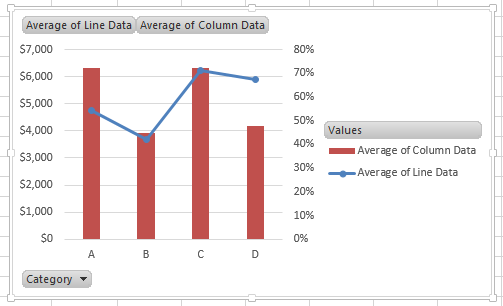
How-to Add a Grand Total Line on an Excel Stacked Column Pivot Chart
Today I answer a viewer question. "How do I add a cumulative grand total amount as a line above a stacked column pivot chart...
Step-by-Step Tutorial: How-to: Make a Company and Industry P/E (Price to Earnings) Line Chart
In my last post I showed the concepts of making a P/E (Price-to-Earnings) Excel Chart for your Dashboard Template. In this post I will...
How-to Add a Line to an Excel Chart Data Table and Not to the...
Many people making Excel charts love to add a Chart Data Table to their graph. However, the Excel Data Tables are not very flexible...
How-to Add Lines in an Excel Clustered Stacked Column Chart
I have posted several Excel chart samples related to Clustered Stacked Column Charts.
In case you missed them, you can check them out here: Excel...
Tiger Woods PGA Tour and Major Championship Chart
I am a fan of the PGA and Tiger Woods. So I was really excited when I saw this post from Paresh Shah of...
How-to Show Gaps in a Line Chart When Using the Excel NA() Function
In last Friday’s challenge, we had a Excel Analyst that needed to remove outliers from his Excel Line Chart. In essence, he wanted to...
How-to Highlight Specific Horizontal Axis Labels in Excel Line Charts
The Problem
Recently a fan contacted me and asked how she change the horizontal axis could do the as follows:
"I am trying to bold 5...


