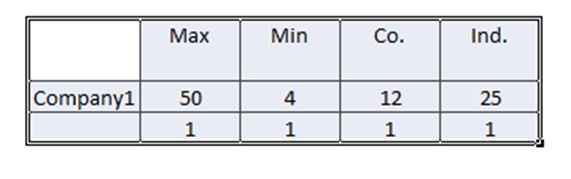
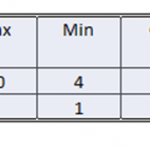
Data Table setup for Using an XY Chart to create a line graph in Microsoft Excel for a Price-to-Earnings Comparison for a company and an industry with minimum and maximum average P/E ratio.
Home Company and Industry P/E (Price to Earnings) Line Chart – 2 Ways Price-To-Earnings Comparison Line Chart using Excel Table Setup
Price-To-Earnings Comparison Line Chart using Excel Table Setup