Tag: Chart
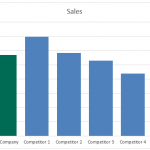
How-to Add Specific RGB or HSL Colors in Your Company Chart or Dashboard
Do you want your Excel charts and dashboards to really stand out at your company?
Well then you should start using custom colors in all...
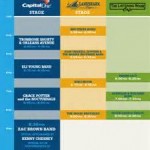
Friday Challenge – Create a Chart to Display a Music Festival Schedule
Here is an interesting question that I saw and I thought I would present it as the next in the series of Friday Challenges.
This...
How-to Graph Three Sets of Data Criteria in an Excel Clustered Column Chart
Here is a very simple solution to a common Excel Charting question when a user wants to graph “Three sets of data criteria on...
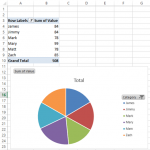
How-to Easily Make a Dynamic PivotTable Pie Chart for the Top X Values
I recently had a request from a fan of the site on how they could make a dynamic pie chart with the Top 5...
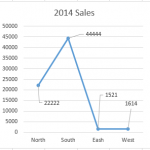
New Chart Label Leader Lines Available in Excel 2013
Did you know that you can now add Leader Lines to your Excel Charts in Excel 2013? I didn't know this until just recently. ...
Think Like a Database Designer Before Creating an Excel Dashboard Chart
Recently, a fan asked for some help. However, when I got their file, I saw that they needed some help with basic concepts, so...
Better Formulas for Pipeline Matching Stacked Bar Chart Colors to Products without VBA Solution
Hands off to Leonid :) for this awesome solution with much Much BETTER formulas for a recent Friday Challenge.
Here was the original Challenge:
friday-challenge-pipeline-usage-chart
Here was...
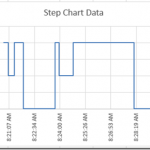
How-to Create a Time Data Series Step Chart in Excel
In our recent Friday challenge, we were asked by Anna how can we make our popular Excel Step Chart work for data that is...
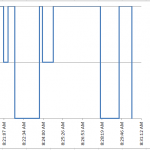
Friday Challenge – Step Chart for an Excel Time Series
I was recently asked for assistance with this request:
Hi Steve,
I am trying to make a hypnogram with data that we collected over the course...
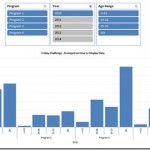
Petes Stumped Chart Challenge Answer – Pivot Chart with Slicers
In the last Friday Challenge, we were going to see if we could help a user create a chart from this data set. They...

