Tag: Excel
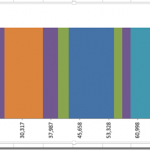
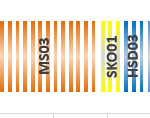
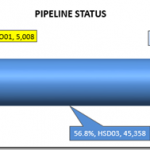
Pipeline Challenge Matching Stacked Bar Chart Colors to Products without VBA
In our recent Friday Challenge, we were tasked with creating a Stacked Bar Chart where the colors matched the products. You can check out...
Friday Challenge – Stumped on How to Display Data in an Excel Chart
I had some great responses to the last Friday Challenge, so I didn't want to stop the momentum with my answer to the last...
Leonid’s Friday Challenge Answer – Pipeline Usage Stacked Bar Chart
Here is a late entry :) Thanks Leonid. This is an Awesome response!
Leonid was responding to this recent challenge: Friday Challenge – Pipeline Usage...
Pipeline Usage Chart – Don’s Answer
Here is another response that I received from Don for our recent Friday Challenge:
Friday Pipeline Usage Challenge
Since we weren’t sure from the client if...
Match Product Chart Colors to Excel Spreadsheet Cells – Pete’s VBA Solution
In the recent Friday Challenge: Create Pipeline Usage Chart
A user wanted to create a bar chart where the values had a specific color by...
Friday Challenge – Pipeline Usage Chart
I recently got a request from a subscriber that asked if I could help them create a cylinder chart. However the sample that was...
Copy Paste vs Fill Handle Copy with Tables References in an Excel formula
In this recent post:
Friday Challenge Answers – Cumulative Events Over Time
I created a formula that referenced a table. As I created my video I...
Challenge Answer – Negative AverageIf for Non-Continuous Range
In our last Friday challenge:
Friday Challenge – AverageIf NOT Blank or NOT Zero with Negative Values for Non-Contiguous Ranges
I wanted to see how you...
Friday Challenge – AverageIf NOT Blank or NOT Zero with Negative Values for Non-Contiguous...
In a recent Friday Challenge, you were tasked with creating a formula that would work out for a non-contiguous (not connected) range that ignored...
Friday Challenge Answers – Cumulative Events Over Time
In our recent Friday Challenge,
Friday Challenge – Creating an Excel Graph of Cumulative Events Over Time
where a user wanted the following:
Creating a graph of...

