Tag: Excel
Friday Challenge – Conditionally Control Excel Bubble Chart Colors
Hi All,
Sorry this is a little late. But better late then never .
Here is this week’s Friday Challenge (on Sunday. I will post my...
How-to Show Gaps in a Line Chart When Using the Excel NA() Function
In last Friday’s challenge, we had a Excel Analyst that needed to remove outliers from his Excel Line Chart. In essence, he wanted to...
How-to Eliminate Statistical Outliers in an Excel Line Chart
Okay, I posted this Excel Chart Challenge on Friday. How did you do? I am sure your solution is better than mine. This was...
Friday Challenge – Eliminating outliers in and Excel Chart
Okay, apologies again . I have been so swamped with my Go-Live project this week that I have been too tired to finish the...
Friday Challenge Answer – Create a Percentage (%) and Value Label within 100% Stacked...
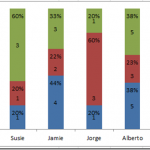
Last week I posted a Friday Excel Challenge!. Fun times. How did you do? Spoiler alert, if you don’t know how to create this...
Friday Challenge – Create a Percentage (%) and Value Label within 100% Stacked Chart?
First I want to say I am sorry to those waiting to see the dynamic chart scroll bar tutorial. My project launched this week...
Multi-Column Stacked Chart – How would you do it? – How I did it.
First, I want to say thank you, because you are an Excel fan. Then again, maybe you are an Excel Geek? I know I...
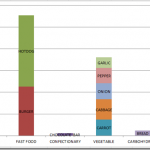
Stacked bar chart with data from multiple columns – How would you do it?
Hello everyone! Thanks for being a fan. I am such a fan of Excel, that meeting MrExcel this week threw me off my schedule. ...
Excel Geek Out with MrExcel
How fun a night I had! Did you ever think that you would meet a couple of Excel gurus and other Excel fans and...
How-to Create a Scroll Bar in Excel to Make Your Dashboard Dynamic
This is part 1 of creating a dynamic Excel dashboard chart using the scroll bar control.
So in the title I said that we would...

